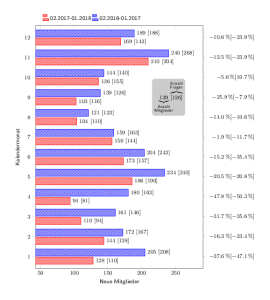
Hier eine Mitgliederstatistik als Vergleich von 2017 A.D. und des Vorjahres; nach der Anzahl der Neuregistrierungen und der Anzahl deren Fragen.
Als besondere Herausforderung erwies sich das Erstellen einer zweiten y-Achse auf der rechten Seite, auf der die prozentualen Veränderungen gegenüber dem Vorjahr angezeigt werden sollen.
Da pgfplots hierfür scheints keinen Standard hat, muss getrickst werden. Zunächst gegenüber den Koordinatenzahlen der linken y-Achse irgendwo unsichtbare “textmarks” platzieren; und dann “nodes near coord” an dem ausgelesenen maximalen x-Wert der axis-Umgebung platzieren.
So bekommt man eine saubere, konsistente zweite y-Achse.
BalkendiagrammNeu.tex
\documentclass[border=5mm, varwidth]{standalone}
\usepackage{pgfplots, amsmath, filecontents}
\usetikzlibrary{patterns}
% J = Jahr, M=Monat, Y=Mitglieder, F=Fragen
\begin{filecontents*}{DatenTabelle.txt}
Jneu Mneu Yneu Fneu Jalt Malt Yalt Falt
2018 1 128 110 2017 1 205 208
2017 12 169 143 2016 12 189 188
2017 11 210 204 2016 11 240 268
2017 10 136 155 2016 10 144 140
2017 9 103 116 2016 9 139 126
2017 8 104 110 2016 8 121 123
2017 7 156 144 2016 7 159 163
2017 6 173 157 2016 6 204 243
2017 5 186 190 2016 5 234 240
2017 4 94 81 2016 4 180 163
2017 3 110 94 2016 3 161 146
2017 2 144 128 2016 2 172 167
\end{filecontents*}
% Styles
\pgfplotsset{compat=1.13, %north west
common/.style={postaction={pattern=north east lines}},
2018AD/.style={common, pattern color=red!70, fill=red!40, draw=red},
2017AD/.style={common, pattern color= blue!70, fill=blue!40, draw=blue},
%
y = 1cm,
ymin=0.4, ymax=12.6,
%
scale only axis,
}
\begin{document}
\begin{tikzpicture}[scale=0.75]
\begin{axis}[
xbar, % Diagrammtyp
enlarge x limits=0.35,
%
font=\footnotesize\sffamily,
%
ytick = data,
%
xlabel={Neue Mitglieder},
ylabel={Kalendermonat},
legend entries={02.2017-01.2018 ,02.2016-01.2017},
legend columns=2,
legend style={anchor=south,legend pos= north west,yshift=1cm, draw=none
}
]
%
\addplot [2018AD,
nodes near coords={\Mitglieder \ [\Fragen]},
every node near coord/.append style={xshift=0pt,font=\footnotesize},
visualization depends on={value \thisrow{Yneu} \as \Mitglieder},
visualization depends on={value \thisrow{Fneu} \as \Fragen},
]
table[x expr=\thisrow{Yneu}, y expr=\thisrow{Mneu}] {DatenTabelle.txt};
%
\addplot [2017AD,
nodes near coords={\Mitglieder \ [\Fragen]},
every node near coord/.append style={xshift=0pt,font=\footnotesize},
visualization depends on={value \thisrow{Yalt} \as \Mitglieder},
visualization depends on={value \thisrow{Falt} \as \Fragen},
]
table[x expr=\thisrow{Yalt}, y expr=\thisrow{Malt}] {DatenTabelle.txt};
%
% Info
\node[fill=lightgray, rounded corners] at (axis cs: 240,9){$\underbrace{139}_{\substack{\textsf{Anzahl} \\ \textsf{Mitglieder}}}\!\!\!\!
\overbrace{[126]}^{\substack{\textsf{Anzahl} \\ \textsf{Fragen}}}$
};
%
% Prozentuale Aenderungen als zweite y-Achse anzeigen ————–
%
% Größten x-Wert auslesen
\def\xMax{\pgfkeysvalueof{/pgfplots/xmax}}
\def\xIst{100}
%
% Rechengrößen festlegen
\newcommand\MitgliederDiff{\pgfmathparse{100*(\yNeu–\yAlt)/\yAlt}\pgfmathprintnumber[fixed zerofill,precision=1]\pgfmathresult\,\%}
\newcommand\FragenDiff{\pgfmathparse{100*(\fNeu–\fAlt)/\fAlt}\pgfmathprintnumber[fixed zerofill,precision=1]\pgfmathresult\,\%}
\newcommand\Diff{$\MitgliederDiff [\FragenDiff]$}
\addplot [only marks, mark=text,
text mark={}, % leer lassen
%visualization depends on={value \thisrow{Mneu} \as \yKoordinate},
visualization depends on={value \thisrow{Yneu} \as \yNeu},
visualization depends on={value \thisrow{Yalt} \as \yAlt},
visualization depends on={value \thisrow{Fneu} \as \fNeu},
visualization depends on={value \thisrow{Falt} \as \fAlt},
%
nodes near coords={\Diff},
%
every node near coord/.style={
shift={(axis direction cs:\xMax–\xIst,0)}, xshift=1.25pt,
anchor= west,
text width=6.9em, align=right,
},
] table[x expr=\xIst, y expr=\thisrow{Mneu}] {DatenTabelle.txt};
\end{axis}
\end{tikzpicture}
\end{document}
Für die Code-Darstellung
[man beachte, dass sich die Zeilennummerierung nicht auswählen lässt. Das macht (fast) kein TeXer]
\usepackage[margin=8mm]{geometry}
\usepackage{selinput}
\SelectInputMappings{adieresis={ä}, germandbls={ß}}
\usepackage[ngerman]{babel}
\usepackage{xcolor}
\pagecolor{lightgray!15}
%=================================
\usepackage{listings}
\renewcommand{\lstlistlistingname}{Codeverzeichnis}
\renewcommand{\lstlistingname}{Quellcode}
% \lstset{caption=\lstname}
% Globale Einstellungen
\lstdefinestyle{latex}{
language=[AlLaTeX]TeX,
frame=single,
backgroundcolor=\color{yellow!30},
rulecolor=\color{lightgray!40},
breaklines=true,
% xleftmargin=\parindent,
basicstyle=\footnotesize\ttfamily,
keywordstyle=\bfseries\color{black!70!purple},
commentstyle=\itshape\color{green!40!black},
identifierstyle=\color{blue},
stringstyle=\color{orange},
}
%=================================
% Globale Einstellungen
\usepackage{accsupp}
%% Nummern nicht auswählbar machen
\newcommand{\noncopynumber}[1]{ \BeginAccSupp{method=escape,ActualText={}}
#1
\EndAccSupp{}}%
%%
\lstset {numberstyle=\tiny\color{gray!90!black}\noncopynumber,
numbers=left,
numbersep=1.5pt,
% stepnumber=2,
columns=flexible,
literate={ä}{{"a}}1{ö}{{"o}}1 {ü}{{"u}}1{ß}{{\ss}}1,
captionpos=b, % t op, b ottom
title=\bfseries %TUT NICHT!!!
}
%=================================
\begin{document}
\lstinputlisting[style=latex, firstline=20]{BalkendiagrammNeu.tex}
\end{document}
